L Ruffino1, A Santoro1, S Sparvieri1, F Regazzoni2, DA Adebo3, AM Quarteroni2, C Vergara1, AF Corno4*
1LABS – Dipartimento di Chimica, Materiali e Ingegneria Chimica “Giulio Natta” – Politecnico di Milano, Milan, Italy
2MOX, Department of Mathematics, Politecnico di Milano, Milan, Italy
3McGovern Medical School at the University of Texas Health Science Center at Houston, Houston, Texas, USA
4School of Engineering, University of Leicester, Leicester, UK
*Correspondence author: Antonio F Corno, MD, FRCS, FACC, FETCS, School of Engineering, University of Leicester, Leicester, LE1 7HR, UK;
Email: [email protected]
*Correspondence author: Antonio F Corno, MD, FRCS, FACC, FETCS, School of Engineering, University of Leicester, Leicester, LE1 7HR, UK;
Email: [email protected]
*Correspondence author: Antonio F Corno, MD, FRCS, FACC, FETCS, School of Engineering, University of Leicester, Leicester, LE1 7HR, UK;
Email: [email protected]
Published Date: 24-08-2023
Copyright© 2023 by Corno AF, et al. All rights reserved. This is an open access article distributed under the terms of the Creative Commons Attribution License, which permits unrestricted use, distribution, and reproduction in any medium, provided the original author and source are credited.
Abstract
Background: The COVID-19 disease can involve any body part; nevertheless, the most serious consequences affect respiratory and cardiocirculatory systems with variable symptoms. Although the effects of COVID-19 are not fully understood yet, clinical evidence has shown that the virus may cause acute myocardial injury and chronic damages to heart and blood vessels. There is no or limited experience on pathophysiological effects of COVID-19 infection in children’s cardiovascular system. The aim of this work is to assess the effects of COVID-19 on the cardiovascular system in children, in terms, e.g., of increased pulmonary resistances, reduced cardiac contraction capacity.
Methods: We used a computational model based on lumped parameters to describe the whole blood circulation. The model was calibrated to account for data coming from pediatric patients.
Results: There were total of 17 pediatric patients diagnosed to have COVID-19 infection based on laboratory and clinical findings. The median age was 15 years (range 7 to 17 years), median weight 61 kg (range 25 to 153 kg), median height 165 cm (range 132 to 191 cm) and median body surface area 1.7 (range 0.95 to 2.8). Our results highlighted that the effect of COVID-19 on the cardiovascular system in all children was characterized by the reduction in cardiac blood pressures and volumes. We analyzed in detail two patients showing a correlation between myocardial compromise and severity of the infection.
Conclusion: Our study demonstrates that COVID-19 infection causes a complex pathophysiological state to the cardiovascular system, both in asymptomatic and symptomatic pediatric patients. This information is very helpful to prevent long term cardiovascular complications of COVID-19 infection in children. A prospective study with regular cardiology follow-up is recommended.
Keywords: Cardiac MRI; Cardiovascular System; Children; Computational Model COVID-19
Abbreviations List
SYSVEN: Systemic Venous Circulation; PULAR: Pulmonary Arterial Circulation; PULVEN: Pulmonary Venous Circulation; SYSAR: Systemic Arterial Circulation; EA: Active Elastance; EB: Passive Elastance; EDV: End Diastolic Volume; ESV: End Systolic Volume; SV: Stroke Volume; EF: Ejection Fraction
Introduction
The COVID-19 disease (Coronavirus Disease 2019) is due to an infection from the SARS-CoV-2 virus. Coronaviruses are a large family of RNA viruses affecting the respiratory system, with symptoms ranging from simple flu to pneumonia and can lead to significant morbidity and mortality. In the past two years, COVID-19 in Europe and worldwide has risen to the top of the main causes of death [1].
Studies and clinical evidence have shown that COVID-19 infection can affect almost all body parts, with mild or severe symptoms; nevertheless, the most serious consequences concern both the respiratory and the cardiocirculatory systems. As the virus enters the body, it binds to the Angiotensin Converting Enzyme 2 (ACE2), involved in blood pressure regulation. If the immune system is successful in blocking the infection, the course of the disease is benign. In some cases, however, the disease can evolve into more severe forms with the possible occurrence of interstitial pneumonia, causing serious damages to the affected area and requiring prolonged respiratory assistance [2]. This is mainly due to the high concentration of the ACE 2 enzyme in type II pulmonary alveolar cells [3]. In general, the ACE 2 amount in each tissue is related to the severity of the disease in that same area. Sometimes the immune response may be excessive and due to a storm of cytokines, the patient may face multiple organ failures and eventually death.
Regarding the cardiovascular system, although the effects of COVID-19 are not fully understood yet, clinical evidence has shown that the virus may cause acute myocardial injury and chronic damages to heart and blood vessels. COVID-19 infection can lead to various types of cardiomyopathies, affecting the myocardial function; myocarditis, arrhythmias and acute heart failure are the potential consequences [4].
Pneumonia is also associated with general effects on blood coagulation caused by the inflammatory reaction of the organism as a whole; the subsequent formation of thrombi can at any time occlude the coronary arteries, impeding the heart perfusion [5]. Inflammatory thrombotic syndrome can affect the pulmonary microcirculation, with progression towards pulmonary embolism and becoming systemic, involving other organs as well. Because of this reason, the death of COVID-19 patients is often caused by myocardial infarction, stroke or pulmonary embolism. In general, in the most critical cases, the patient may face heart failure, cardiogenic shock and at the end, death is determined by cardiorespiratory arrest [6].
Cardiovascular complications are not limited to the hospitalized symptomatic patients but may also appear in asymptomatic patients spending the COVID-19 positivity’s period at home. Complications involving the cardiovascular system represent one of the main effects of COVID-19 infection; the presence of previous heart disease, on the other hand, affects the prognosis in COVID-19 patients, making them more vulnerable and susceptible to severe or lethal forms of the disease [7-9].
According to a report by the Italian “Istituto Superiore di Sanità” (Fig. 1), of the approximately 60,000 patients who died from COVID-19 in Italy in 2020, 70% had arterial hypertension, 25% ischemic heart disease and the same percentage atrial fibrillation; lastly, 20% had heart failure [10]. These are the most common diseases accelerating COVID-19 development and responsible for its mortality, especially in elderly people.
The present study focuses on the analysis of how COVID-19 could affect the cardiovascular system in pediatric patients: even though for this age group less than 1% of positive cases experienced severe forms of the disease, clinical data show changes in the main physiological cardiac parameters, even in asymptomatic subjects. Ultimately, this study has been designed to investigate the cardiac function in children, with the goal to investigate the possibility of myocardial damages and prevent possible long-term problems and pathologies [11-14].
To this aim, a mathematical model based on a lumped parameters description of the whole cardiovascular network, calibrated on data from pediatric patients, was set and used to simulate, albeit in a simplified manner, the behavior of a tremendously complex system, by virtually varying some parameters of interest and assessing their effect. The use of computational models in relation to medicine allows to simulate different clinical scenarios describing both physiological and pathological phenomena [15-18]. Models could be exploited in the diagnostic phase and represent a non-invasive technique for the integral study of pathologies and their evolution; they can be also used to assist doctors in choosing the most appropriate therapy.
Methods
The Lumped Parameters Computational Model
A previously developed lumped parameters (0D) model of the cardiovascular system was used for the data analysis study; this model was originally exploited to perform numerical simulation defining the COVID-19 effect on adults [19]. Specifically, heart and systemic and pulmonary circulations were modeled by a set of electrical components defining a circuit. 0D models were based on compartments, each with its own hemodynamic characteristics. Fig. 2 shows the circuit and compartments’ characterization with electrical equivalents.
Lumped parameters blood flow models could be understood by means of an electric analogy, where pressure variations between compartments are interpreted as the electrical potential, whereas the blood flow rate as the current. The other analogies are reported in Fig. 2. It shows the lumped parameters model considered in this work, with systemic and pulmonary circulations and the heart function. In agreement with medical-scientific origin information, for both the systemic and pulmonary circulation, the model has two distinct resistances for the venous and arterial compartments. The four cardiac chambers’ compliance is expressed by an elastance varying over time: indeed, the model considers both the passive and active behavior of the myocardium. Finally, each of the four heart valves is modeled with a non-ideal diode; this association is explained by the diode’s switch operation: heart valves can be seen as open or closed switches depending on the difference in blood pressure between upstream and downstream compartments and on the direction of blood flow.
Differential Equations and Numerical Solution
Starting from circuit components it is possible to define a set of time-dependent ordinary differential equations that describe the cardiovascular system’s hemodynamics and whose solutions were obtained by means of numerical algorithms [20-24]. Such equations represent the mass and momentum conservation at each node and circuit of the network showed in Fig. 2.
The 0D model was discretized over time using a variable order and variable step size solver. The implementation was realized in the Matlab programming environment, using a solver developed for ordinary differential equations (ode15s). To guarantee results consistency, the algorithm defining the model was implemented for several cycles; when the transient phase was over, the only last simulated heartbeat was considered for the analysis.
A crucial role was played by the list of initial conditions and input parameters contributing to the definition of problem’s data; among them: heart rate, active and passive elastance, capacities and resistances. To obtain patient-specific data, such parameters need to be calibrated by using suitable measures such as heart volumes, pressure and flow rates. Once the network was calibrated, it was possible to obtain as output pressures, blood flows and volumes in each compartment (and not only at the measures points) and at each time (and not only at the measures instants). This allowed us to build a series of Wiggers diagrams and pressure-volume loops (PV loop) for each patient; these images describe the characteristic trends of pressures, flows and heart volumes.
Setting of the Healthy Child Case
The first step was to build a 0D model for the “healthy” child case. To this aim, we started from the model parameters of the healthy adult case and we varied them in accordance with some evidence. Thus, the main physiological and anatomical differences between children’s cardiovascular system and adults’ ones were clearly identified. First, we increased the input heart rate because of the higher average values found in children: from an average HR of 72 bpm (in adults) to 90 bpm (average value referred to children). Secondly, based on clinical evidence, we assumed a 60% increase in arterial and venous resistance. In fact, the reduced diameter of the blood vessels in pediatric age involves (due to the law of Poiseuille) an increase in resistance as shown below.
![]()
The factor η indicates the viscosity of the fluid, l the length of the vessel and r its radius.
Finally, the last parameter subjected to perturbation is the passive elastance (inverse of compliance). In physiology, compliance is the ability of blood vessels to stretch under the effect of increasing blood pressure and then shrink returning the volume of blood accumulated under the effect of decreasing pressure. It has been shown that compliance is reduced in the development phase and therefore elastance was increased by 80%. To assess the validity of such choices, we validated them against measures of healthy cases reported in the literature. These are listed in Table 1, with a slight reduction in systolic blood pressure in children and substantial reduction in blood volumes, mostly due to reduced children’s frame, with consequent reductions of SV and EF [20-23]. Based on these physiological data, we built a reference configuration of a healthy and normal-weight child, then compared with the data collected in real patients affected by COVID-19, see next section.
Input’s Perturbation and Model’s Calibration
The technique used to calibrate the model in different configurations of pathological patients is here reported. The idea of calibrating a model is to properly vary the parameters (i.e., resistances, inductances, capacities and elastances) and initial conditions to obtain output results as much as possible in agreement with known data coming from clinical measurements. The latter were recorded at our institution during the hospital stay of patients under the age of 18 years. In addition to the personal data, for each patient, we had at our disposal the main parameters of physical constitution (weight, height and Body Surface Area); a set of laboratory test results indicating the possible presence of inflammation in the body; monitoring measures such as heart rate, systemic blood pressure and oxygen saturation; measurements of characteristic blood volumes for each of the four cardiac chambers obtained by echocardiography and by cardiovascular magnetic resonance imaging; hospitalization time and Intensive Care Unit (ICU) stay are reported. Table II shows some of the most significant measurements. Among the data, the heart rate recorded at the time of hospitalization was included directly as a model input, while left ventricle’s cardiac volumes and maximum and minimum systemic blood pressures were used as targets to be achieved in simulations during the calibration.
For each patient, a combination of inputs was then designed to produce results as close to the targets as possible. To do this, the inputs were varied with caution, first with limited alterations to study the performance of the results, then with more marked variations, until reaching configurations that were acceptable for almost all the outputs.
QUANTITY | ADULT | CHILD |
P_MAX [mmHg] | 135-140 | 110-130 |
P_MIN [mmHg] | 75-90 | 70-80 |
EDV [ml] | 125-140 | 90-100 |
ESV [ml] | 40-50 | 40-50 |
SV [ml] | 90-95 | 45-50 |
EF [-, %] | 55-65 | 45-50 |
HR [bpm] | 60-80 | 80-100 |
Table 1: Adult-Children comparison. Main differences between physiological cardiac values in adults and children, ranges taken from the literature.
Patient | Gender (M=1, F=2) | Age | HR (bpm) | Pressure (mmHg) |
1 | 1 | 12 | 98 | 107/57 |
2 | 1 | 12 | 98 | 91/52 |
3 | 2 | 12 | 150 | 100/51 |
4 | 2 | 8 | 124 | 70/46 |
5 | 2 | 7 | 137 | 90/47 |
Patient | LVEF (%) | LVEDV (ml) | LVESV (ml) | SV (ml) |
1 | 72 | 162 | 45 | 117 |
2 | 67 | 171 | 57 | 114 |
3 | 60 | 92 | 37 | 55 |
4 | 56 | 67 | 30 | 37 |
5 | 59 | 86 | 36 | 50 |
Table 2: Patients’ data. HR used as input, pressures and volumes as target during calibration.
Results
There were total of 17 pediatric patients who were diagnosed to have COVID-19 infection based on laboratory and clinical findings. The median age was 15 years (range 7 to 17 years), median weight 61 kg (range 25 to 153 kg), median height 165 cm (range 132 to 191 cm) and median body surface area was 1.7 (range 0.95 to 2.8). The values of parameters chosen for the healthy child case according to the physiological evidence are reported in Table 3. In the same table, pressure and volumes values computed with the 0D model are reported. Such values are within the physiological ranges reported in Table 1, apart from the diastolic pressure slightly overestimating the standard case. This provided a partial validation of the healthy child 0D model. Table 4 shows the results of the calibration procedure performed on selected five patients. We report both the calibrated parameters and the output of the numerical simulations. By comparing such results with the measures reported in Table 2, we noticed that the blood volumes were the outputs most in agreement with targets. The pressures (in particular, the diastolic pressure) were slightly outside of the target; this is aligned to the previous calibration on adults where output pressures were slightly higher than physiological ones.
The calibration of the 0D model for each of the five patients allowed us to plot the evolution over time of some quantities of interest, thus providing information absent from the measurement dataset. We selected two representative patients: P4 who showed severe symptoms and required intensive care treatments for a few days (referred as ICU stay) and P5, suffering from mild symptoms to asymptomatic COVID-19, who did not require admission to intensive care unit (referred to as NO-ICU). For such patients, Fig. 3 shows the PV loops obtained from our computations, compared with the healthy child case. The NO-ICU patient PV loop presents a reduction of width on both axes, both for volumes and pressures, resulting smaller when compared to the generic healthy child’s one. As evidence of this, the stroke volume, 41 ml, compared with 49 ml of the healthy child confirms the reduced heart’s pumping capacity; the same applies to the maximum and minimum pressures, significantly reduced compared to the physiological baseline (maximum pressure reduction equal to 25%). The patient who required ICU stay had the PV loop showing an exasperation of the results obtained for the asymptomatic patient. Once again, we noticed a shrinking of the PV loop on the two axes. The stroke volume was significantly reduced in the severe COVID-19 case (in red) with a value of 38 ml compared to 49 ml of the healthy case (computed reduction of 22%). The stroke volume’s reduction depends on a decrease of the maximum filling of the cardiac chambers (in this case the left ventricle) with negative effects on blood’s peripheral distribution. A sharp drop in pressures was recorded, with the systolic pressure decreased almost 35%, while the decline of the diastolic pressure reached the 39%. The systemic arterial blood pressure along few heartbeats is reported in Fig. 3. For the entire timeframe considered, the curves describing the patients have lower values than the baseline, confirming the overall reduction in pressure in COVID-19 infection case, with the ICU period characterized by the lowest values. Fig. 3 shows the progressive reduction of the left ventricle blood volume from the healthy case to the ICU one; to compensate for such decrease, the heart rate increased to provide adequate cardiac output. The heart, however, is not able to sustain elevated heart rate for a long time, since this can cause heart failure. Tachycardia also leads to reduced diastole duration, with negative effects on myocardial perfusion, caused by reduction of the coronary artery perfusion.
Parameters | Values |
EA_LA [mmHg/ml] | 0.07 |
EA_LV [mmHg/ml] | 2.75 |
EA_RA [mmHg/ml] | 0.06 |
EA_RV [mmHg/ml] | 0.55 |
EB_LA [mmHg/ml] | 0.162 |
EB_LV [mmHg/ml] | 0.144 |
EB_RA [mmHg/ml] | 0.126 |
EB_RV [mmHg/ml] | 0.09 |
R_AR_SYS [mmHg s/ml] | 1.024 |
R_VEN_SYS [mmHg s/ml] | 0.416 |
R_AR_PUL [mmHg s/ml] | 0.05136 |
R_VEN_PUL [mmHg s/ml] | 0.05712 |
HR [bpm] | 90 |
P_MAX [mmHg] | 126 |
P_MIN [mmHg] | 95 |
EDV [ml] | 93 |
ESV [ml] | 44 |
SV [ml] | 49 |
EF [-, %] | 53 |
Table 3: The healthy child case. Values of the 0D parameters (up) and output of the corresponding simulations (bottom).
Patient | 1 | 2 | 3 | 4 | 5 | |
P A R A M E T E R S
| EA_LA [mmHg/ml] | 0.05 | 0.04 | 0.07 | 0.06 | 0.06 |
EA_LV [mmHg/ml] | 1.93 | 1.65 | 2.75 | 2.48 | 2.23 | |
EA_RA [mmHg/ml] | 0.42 | 0.04 | 0.06 | 0.05 | 0.05 | |
EA_RV [mmHg/ml] | 0.39 | 0.33 | 0.55 | 0.50 | 0.44 | |
EB_LA [mmHg/ml] | 0.09 | 0.09 | 0.18 | 0.23 | 0.19 | |
EB_LV [mmHg/ml] | 0.08 | 0.08 | 0.16 | 0.2 | 0.17 | |
EB_RA [mmHg/ml] | 0.07 | 0.07 | 0.14 | 0.18 | 0.15 | |
EB_RV [mmHg/ml] | 0.05 | 0.05 | 0.10 | 0.13 | 0.11 | |
R_AR_SYS [mmHg s/ml] | 0.256 | 0.224 | 0.448 | 0.480 | 0.512 | |
R_VEN_SYS [mmHg s/ml] | 0.104 | 0.091 | 0.182 | 0.195 | 0.208 | |
R_AR_PUL [mmHg s/ml] | 0.045 | 0.045 | 0.042 | 0.096 | 0.060 | |
R_VEN_PUL [mmHg s/ml] | 0.049 | 0.049 | 0.046 | 0.107 | 0.068 | |
HR [bpm] | 98 | 98 | 150 | 124 | 137 | |
O U T P U T | P_MAX [mmHg] | 107 | 104 | 106 | 82 | 95 |
P_MIN [mmHg] | 45 | 40 | 73 | 58 | 68 | |
EDV [ml] | 158 | 168 | 87 | 69 | 82 | |
ESV [ml] | 52 | 58 | 37 | 31 | 41 | |
SV [ml] | 106 | 110 | 50 | 38 | 41 | |
EF [-, %] | 67 | 65 | 58 | 55 | 50 |
Table 4: Model calibration parameters and simulation outputs. Results of the calibration (above) and of the main outputs (below) of the numeric simulations for the five patients.
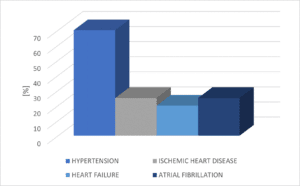
Figure 1: Previous heart disease impact. Incidence of chronic cardiovascular diseases in patients died from COVID-19 [10].
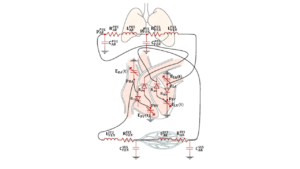
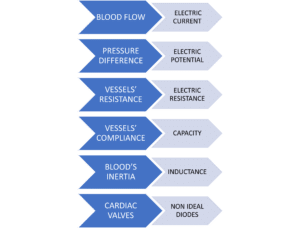
Figure 2: Lumped parameters model. A: the lumped parameters computational model. B: summary of electrical analogies in the 0D model.
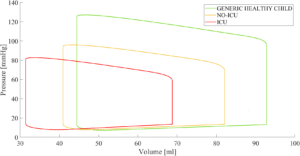
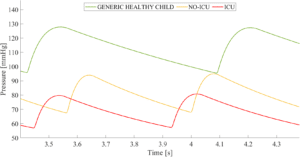
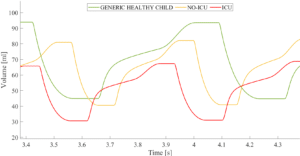
Figure 3: PV Loop and Wiggers Diagrams. A: left ventricle PV loop comparison between a generic healthy child not affected by COVID-19 (in green), NO-ICU COVID-19 pediatric patient (in yellow) and ICU COVID-19 pediatric patient (in red); B: systemic blood pressure time frame comparison; C: left ventricle time frame comparison.
Discussion
There are limited previous reports on the short and long-term myocardial effects of COVID-19 in children [26]. The following features have been described on the cardiovascular circulations in pediatric patients affected by COVID-19, with signs and symptoms: tachycardia elevated levels of C-reactive protein, elevated troponin levels evidence of myocarditis [26-30]. Reported treatments were required: admission to Intensive Care Unit vasoactive support respiratory support, Extra-Corporeal Membrane Circulation (ECMO) [31,32]. Variable percentages of mortality were also reported, from 0 to 4.7% [26,29-31]. Despite impairment of the myocardial function was noted in all the above studies with echocardiography, children affected by COVID-19 rarely underwent cardiac MRI or it has been suggested as surveillance protocol [29-31]. In any case, to the best of our knowledge, our previously developed lumped parameters (0D) computational model has been only used in adult patients, while so far it has never been reported for the data analysis study in children affected by COVID-19 [19]. Furthermore, for our study we performed computational analysis of cardiovascular effects of COVID-19 infection in children compared to healthy cases. As we did not observe the evolution of the clinical situation of a healthy child after being affected by COVID-19, with the subsequent changes of the myocardial function, this computational approach, based on cardiac MRI and Echo-Doppler to acquire pressure and volumes data, is reliable and suitable for a qualitative analysis, while it is not easily applicable for a quantitative analysis of each specific patient. This reproducible study demonstrates the complex pathophysiological state that COVID-19 infection causes to the cardiovascular system, both in asymptomatic and symptomatic patients. Despite the different manifestations of the symptoms, the pediatric patients showed cardiovascular complications, with impairment of the myocardial function correlated with the severity of the clinical symptoms. The present study limitation is that, as we did not have any baseline patient data prior to the infection, we could not compare the condition before and after the COVID-19 infection; as control group we used literature data on healthy individuals. Furthermore, the model was customized on the basis of global quantities, such as EDV and ESV and not on the specific ventricular geometry of each patient. A study performed using three-dimensional models customized from imaging data could be potentially considered in the future, although this would entail a significant increase in computational time and costs [25].
Conclusion
In conclusion, our computational study showed that the COVID-19 infection effects on the cardiovascular system in children were accompanied by reductions in blood pressure and volumes of the cardiac chambers and impairments in both systemic and pulmonary circulations. In two patients suffering from COVID-19 our study demonstrated the correlation between myocardial compromise and severity of the clinically compromised situation induced by COVID-10 infection. The long-term effects of COVID-19 are largely unknown, particularly the effects on the myocardium of pediatric patients: these negative effects have now been proved also in children, initially considered a category with low risk. In the future it will therefore be important to follow the clinical evolution of these patients with regular follow-up. Prospective study with regular cardiology follow-up is recommended to evaluate potential long-term myocardial effects of COVID-19 infection in children.
Conflict of Interest
The authors have no conflict of interest to declare.
References
- World Health Organization. Global research on coronavirus disease (COVID-19). 2022.
- Madjid M, Safavi-Naeini P, Solomon SD, Vardeny O. Potential effects of coronaviruses on the cardiovascular system: a review. JAMA Cardiol. 2020;5(7):831-840.
- Das BB, Tejtel SK, Deshpande S, Shekerdemian LS. A review of the cardiac and cardiovascular effects of COVID-19 in adults and children. Texas Heart Institute Jl. 2021;48(3).
- IRCCS Humanitas research hospital, “Cardiomyopathy”. 2022.
- Sobh E, Reihan MS, Hifnawy TM, Abdelsalam KG, Awad SS, Mahmoud NM, Sindi NA, Alhadrami HA. Cardiovascular system and coronavirus disease-2019 (COVID-19): mutual injuries and unexpected outcomes. The Egyptian Heart J. 2021;73:1-3.
- Long B, Brady WJ, Koyfman A, Gottlieb M. Cardiovascular complications in COVID-19. Am J Emerg Med. 2020;38(7):1504-7.
- Phelps M, Christensen DM, Gerds T, Fosbøl E, Torp-Pedersen C, Schou M, et al. Cardiovascular comorbidities as predictors for severe COVID-19 infection or death. European Heart J-Quality of Care and Clinical Outcomes. 2021;7(2):172-80.
- Bae S, Kim SR, Kim MN, Shim WJ, Park SM. Impact of cardiovascular disease and risk factors on fatal outcomes in patients with COVID-19 according to age: a systematic review and meta-analysis. Heart. 2021;107(5):373-80.
- Li X, Guan B, Su T, Liu W, Chen M, Waleed KB, et al. Impact of cardiovascular disease and cardiac injury on in-hospital mortality in patients with COVID-19: a systematic review and meta-analysis. Heart. 2020;106(15):1142-7.
- Masocco M, Valentina Minardi e Benedetta Contoli per conto del Gruppo tecnico nazionale PASSI e PASSI d’Argento, Graziano Onder e Luigi Palmieri per il Gruppo della Sorveglianza COVID-19**, Angela Spinelli, Nicola Vanacore – (ISS), (2020), “Il ruolo delle patologie croniche pregresse nella prognosi dei pazienti COVID-19”, Istituto Superiore Di Sanità. 2020.
- Zachariah P, Johnson CL, Halabi KC, Ahn D, Sen AI, Fischer A. Epidemiology, clinical features and disease severity in patients with Coronavirus disease 2019 (COVID-19) in a children’s hospital in New York city, New York. JAMA Pediatr. 2020;174(10):e202430.
- Shekerdemian LS, Mahmood NR, Wolfe KK, Riggs B, Ross C, McKiernan C, et al. Characteristics and outcomes of children with Coronavirus Disease 2019 (COVID-19) infection admitted to US and Canadian pediatric intensive care units. JAMA Pediatr. 2020;174(9):868-73.
- Fisler G, Izard SM, Shah S, Lewis D, Kainth MK, Hagmann SHF, et al. Northwell COVID-19 Research Consortium. Characteristics and risk factors associated with critical illness in pediatric COVID-19. Ann Intensive Care. 2020;10(1):171.
- Dong Y, Mo X, Hu Y, Qi X, Jiang F, Jiang Z, et al. Epidemiology of COVID-19 among children in China. Pediatrics. 2020;145(6):e20200702.
- Blanco PJ, Feijóo RA. A 3D-1D-0D computational model for the entire cardiovascular system. Mecánica Computacional. 2010;29(59):5887-911.
- Hirschvogel M, Bassilious M, Jagschies L, Wildhirt SM, Gee MW. A monolithic 3D‐0D coupled closed‐loop model of the heart and the vascular system: experiment‐based parameter estimation for patient‐specific cardiac mechanics. Int J Numerical Methods Biomedical Engineering. 2017;33(8):e2842.
- Quarteroni A, Manzoni A, Vergara C. Mathematical modelling of the human cardiovascular system: data, numerical approximation, clinical applications. Cambridge University Press. 2019.
- Quarteroni A, Dedè L, Regazzoni F. Modeling the cardiac electromechanical function: A mathematical journey. Bulletin Am Mathematical Society. 2022;59(3):371-403.
- Dedè L, Regazzoni F, Vergara C, Zunino P, Guglielmo M, Scrofani R, et al. Modeling the cardiac response to hemodynamic changes associated with COVID-19: a computational study. Mathematical Biosciences and Engineering. 2021;18:3364-83.
- Conti F, Battaglini PP, Mora E. Fisiologia medica. McGraw-Hill. 2010.
- Dee U. Silversthorn, Fisiologia umana. Un approccio integrato. Pearson. 2020.
- Kliegman N, St.Geme S, Behrman S. Pediatria di Nelson. Elsevier-Masson. 2012.
- Zuccotti GV. Manuale di pediatria. La pratica clinica. Società Editrice Esculapio; 2019.
- Quarteroni A, Veneziani A, Vergara C. Geometric multiscale modeling of the cardiovascular system, between theory and practice. Comp Meth Appl Mech Eng. 2016;302:193-252.
- Regazzoni F, Salvador M, Africa PC, Fedele M, Dedè L, Quarteroni A. A cardiac electromechanical model coupled with a lumped-parameter model for closed-loop blood circulation. J Computational Physics. 2022;457:111083.
- Dufort EM, Koumans EH, Chow EJ, Rosenthal EM, Muse A, Rowlands J, et al. Multisystem inflammatory syndrome in in children of New York state. N Engl J Med 2020;383:347-58.
- Ludwigsson JF. Case report and systematic review suggest that children may experience similar long-term effects to adults after clinical COVID-19. Acta Paediatrica. 2021;110:914-21.
- Aeschlimann FA, Misra N, Hussein T, Panaioli E, Soslow JH, Crum K, et al. Myocardial involvement in children with post-COVID multisystem inflammatory syndrome: a cardiovascular magnetic resonance based multicenter international study-the CARDOVID registry. J Cardiovasc Magn Res. 2021;23;140.
- Ramcharan T, Nolan O, Lai CY, Prabhu N, Krishnamurthy R, Richter AG, et al. Paediatric inflammatory multisystem syndrome: temporally associated with Sars‑Cov‑2 (pims‑ts): cardiac features, management and short‑term outcomes at a UK tertiary paediatric hospital. Pediat Cardiol. 2020;41:1391-401.
- Patel T, Kelleman M, West Z, Peter A, Dove M, Butto A, et al. Comparison of multisystem inflammatory syndrome in children–related myocarditis, classic viral myocarditis and covid‐19 vaccine‐related myocarditis in children. J Am Heart Assoc. 2022;11:e024393.
- Feldstein LR, Rose EB, Horwitz SM, Collins JP, Newhams MM, Son MB, et al. Multisystem inflammatory syndrome in US children and adolescents. N Engl J Med 2020;383:334-46.
Article Type
Research Article
Publication History
Received Date: 29-07-2023
Accepted Date: 16-08-2023
Published Date: 24-08-2023
Copyright© 2023 by Corno AF, et al. All rights reserved. This is an open access article distributed under the terms of the Creative Commons Attribution License, which permits unrestricted use, distribution, and reproduction in any medium, provided the original author and source are credited.
Citation: Corno AF, et al. Computational Analysis of Cardiovascular Effects of COVID-19 Infection in Children. J Pediatric Adv Res. 2023;2(2):1-10.

Figure 1: Previous heart disease impact. Incidence of chronic cardiovascular diseases in patients died from COVID-19 [10].


Figure 2: Lumped parameters model. A: the lumped parameters computational model. B: summary of electrical analogies in the 0D model.


Figure 3: PV Loop and Wiggers Diagrams. A: left ventricle PV loop comparison between a generic healthy child not affected by COVID-19 (in green), NO-ICU COVID-19 pediatric patient (in yellow) and ICU COVID-19 pediatric patient (in red); B: systemic blood pressure time frame comparison; C: left ventricle time frame comparison.
QUANTITY | ADULT | CHILD |
P_MAX [mmHg] | 135-140 | 110-130 |
P_MIN [mmHg] | 75-90 | 70-80 |
EDV [ml] | 125-140 | 90-100 |
ESV [ml] | 40-50 | 40-50 |
SV [ml] | 90-95 | 45-50 |
EF [-, %] | 55-65 | 45-50 |
HR [bpm] | 60-80 | 80-100 |
Table 1: Adult-Children comparison. Main differences between physiological cardiac values in adults and children, ranges taken from the literature.
Patient | Gender (M=1, F=2) | Age | HR (bpm) | Pressure (mmHg) |
1 | 1 | 12 | 98 | 107/57 |
2 | 1 | 12 | 98 | 91/52 |
3 | 2 | 12 | 150 | 100/51 |
4 | 2 | 8 | 124 | 70/46 |
5 | 2 | 7 | 137 | 90/47 |
Patient | LVEF (%) | LVEDV (ml) | LVESV (ml) | SV (ml) |
1 | 72 | 162 | 45 | 117 |
2 | 67 | 171 | 57 | 114 |
3 | 60 | 92 | 37 | 55 |
4 | 56 | 67 | 30 | 37 |
5 | 59 | 86 | 36 | 50 |
Table 2: Patients’ data. HR used as input, pressures and volumes as target during calibration.
Parameters | Values |
EA_LA [mmHg/ml] | 0.07 |
EA_LV [mmHg/ml] | 2.75 |
EA_RA [mmHg/ml] | 0.06 |
EA_RV [mmHg/ml] | 0.55 |
EB_LA [mmHg/ml] | 0.162 |
EB_LV [mmHg/ml] | 0.144 |
EB_RA [mmHg/ml] | 0.126 |
EB_RV [mmHg/ml] | 0.09 |
R_AR_SYS [mmHg s/ml] | 1.024 |
R_VEN_SYS [mmHg s/ml] | 0.416 |
R_AR_PUL [mmHg s/ml] | 0.05136 |
R_VEN_PUL [mmHg s/ml] | 0.05712 |
HR [bpm] | 90 |
P_MAX [mmHg] | 126 |
P_MIN [mmHg] | 95 |
EDV [ml] | 93 |
ESV [ml] | 44 |
SV [ml] | 49 |
EF [-, %] | 53 |
Table 3: The healthy child case. Values of the 0D parameters (up) and output of the corresponding simulations (bottom).
Patient | 1 | 2 | 3 | 4 | 5 | |
P A R A M E T E R S
| EA_LA [mmHg/ml] | 0.05 | 0.04 | 0.07 | 0.06 | 0.06 |
EA_LV [mmHg/ml] | 1.93 | 1.65 | 2.75 | 2.48 | 2.23 | |
EA_RA [mmHg/ml] | 0.42 | 0.04 | 0.06 | 0.05 | 0.05 | |
EA_RV [mmHg/ml] | 0.39 | 0.33 | 0.55 | 0.50 | 0.44 | |
EB_LA [mmHg/ml] | 0.09 | 0.09 | 0.18 | 0.23 | 0.19 | |
EB_LV [mmHg/ml] | 0.08 | 0.08 | 0.16 | 0.2 | 0.17 | |
EB_RA [mmHg/ml] | 0.07 | 0.07 | 0.14 | 0.18 | 0.15 | |
EB_RV [mmHg/ml] | 0.05 | 0.05 | 0.10 | 0.13 | 0.11 | |
R_AR_SYS [mmHg s/ml] | 0.256 | 0.224 | 0.448 | 0.480 | 0.512 | |
R_VEN_SYS [mmHg s/ml] | 0.104 | 0.091 | 0.182 | 0.195 | 0.208 | |
R_AR_PUL [mmHg s/ml] | 0.045 | 0.045 | 0.042 | 0.096 | 0.060 | |
R_VEN_PUL [mmHg s/ml] | 0.049 | 0.049 | 0.046 | 0.107 | 0.068 | |
HR [bpm] | 98 | 98 | 150 | 124 | 137 | |
O U T P U T | P_MAX [mmHg] | 107 | 104 | 106 | 82 | 95 |
P_MIN [mmHg] | 45 | 40 | 73 | 58 | 68 | |
EDV [ml] | 158 | 168 | 87 | 69 | 82 | |
ESV [ml] | 52 | 58 | 37 | 31 | 41 | |
SV [ml] | 106 | 110 | 50 | 38 | 41 | |
EF [-, %] | 67 | 65 | 58 | 55 | 50 |
Table 4: Model calibration parameters and simulation outputs. Results of the calibration (above) and of the main outputs (below) of the numeric simulations for the five patients.


