Fahmy RM1,2*
1Department of Optometry and Vision Sciences, College of Applied Medical Sciences, King Saud University, Riyadh, KSA
2Ophthalmology Department, College of Medicine, Cairo University, Egypt
*Correspondence author: Rania Medhat Fahmy, Associate Professor, Department of Optometry and Vision Sciences, College of Applied Medical Sciences, King Saud University; KSA and Department of Ophthalmology, College of Medicine, Cairo University, Giza, Egypt; Email: [email protected]
Published Date: 30-05-2024
Copyright© 2024 by Fahmy RM, et al. All rights reserved. This is an open access article distributed under the terms of the Creative Commons Attribution License, which permits unrestricted use, distribution, and reproduction in any medium, provided the original author and source are credited.
Abstract
Background: The retina is a light-sensitive nerve layer located at the back of the eye that creates images of objects. These cells kept alive by getting oxygen and nutrients from tiny blood vessels in the eye. Retinopathy is a disease of the retina that is more prevalent in type 2 diabetes mellitus patients. Diabetic retinopathy is a leading cause of blindness because hyperglycemia weakens retinal capillaries, resulting in leakage of blood into the surrounding space. This bleeding can result in formation of scar tissue, which can cause traction retinal detachment and maculopathy. The development of a panel of blood biomarkers to monitor diabetic retinopathies is essential for both diagnosis and prognosis. Proteomics as a powerful tool for the analysis of complex mixtures of proteins and the identification of biomarkers can be of great importance.
Purpose: To detect early nerve fiber layer changes around macula and optic disc in diabetic patients and to correlate diabetic retinopathy with blood antioxidants and gut microbiota in T2DM in Saudi patients.
Materials and Methods: In this cross-sectional case-control study, a total of 77 eyes of 39 subjects aged 40-60 years who did not have any history of eye injuries or eye diseases affecting fundus viewing, were recruited from King Saud University Campus and the department of ophthalmology in King Abdul Aziz university hospital in Riyadh. All subjects underwent full ophthalmic examination including Peripapillary retinal nerve fiber layer thickness and macular profile, Proteomic approach of collected overnight fasting plasma and Microbial stool examination.
Results: The nerve fiber layer thickness around the optic disc was measured for all groups and there was no statistically significant difference in all quadrants between groups. The total retinal thickness at the macular area was different among all groups and tends to increase in group 3 due to diabetic retinopathy. The macular thickness in the 4 quadrants revealed no statistical difference except in the inferior quadrant. Glutathione S transferase and lipid peroxides showed no significant difference between the three studied groups; vitamin C and Glutathione were surprisingly higher in controlled diabetic patients relative to controls. Moreover, over growth of bacteroids participated to the evolution of retinopathy in diabetic patients.
Conclusion: As hyperglycemia and oxidative stress are implicated in the pathogenesis of diabetic retinopathy, the present study certified that the progressive damage can be delayed in controlled type 2 diabetic patients using different treatment modalities that subside oxidative stress.
Keywords: Diabetic Retinopathy; Retinal Nerve Fiber Layer Thickness; Blood Antioxidant; Gut Microbiota
Introduction
Diabetes Mellitus is an endocrine disorder characterized by raised blood glucose level that is caused by disturbed insulin production, insulin function or both processes. Diabetes for long periods is distinguished with permanent damage and malfunctions of most human body organs as eyes, kidney and blood vessels [1]. In other word, it can be defined as a metabolic disorder associated with chronic hyperglycemia that is accompanied by deteriorated macronutrients metabolism [2]. Many pathogenic processes are responsible for diabetes development, ranging pancreatic ß-cells autoimmune destruction causing insulin deficiency or resistance [3].
Different diabetes clinical presentations are associated with high risk of long-term sequelae. These usually appear after ten years but can be the first presentation in asymptomatic people. The major complications are related to injured major vasculature (macroangiopathy). Diabetes mellitus raises cardiovascular disorders risk and around 75% of deaths in diabetics are due to coronaries diseases. Cerebrovascular stroke and peripheral vascular diseases are possible macro vascular complications. The primary diabetic complications are caused by microvascular occlusion (microangiopathy) including the eyes, nerves and kidneys [4].
Diabetic retinopathy is a major cause of blindness all over the world. It may result in visual loss as a result of maculopathy and proliferative retinopathy consequences as vitreous hemorrhage, tractional retinal detachment and secondary neovascular glaucoma. Diabetic retinopathy proliferation increases with prolonged duration of diabetes mellitus. Diabetic retinopathy complications affect 50% of type 1 DM patients and 30% of type 2 DM patients [5]. Diabetic retinopathy development can be decreased by frequent follow up, blood glucose, pressure and cholesterol regulation [6].
Diabetic retinopathy is largely asymptomatic and, worsening of vision is developed over time when pathology may be significantly progressed. Hence, checkup is essential to determine the evolvement of the disease [7]. Various classifications are used to describe the severity of diabetic retinopathy, although classically it is categorized into two main clinical forms: non-proliferative and proliferative diabetic retinopathy [8]. Optical coherent tomography is the new imaging technique that provide information about retinal volume and configuration of the macular region for clinical diagnosis of diabetic retinopathy [9]. Treatment modalities should be addressed toward both ocular and systemic sides of the disease. Systemic aspects involve blood glucose, pressure and cholesterol. Moreover, ocular treatment can be accomplished by argon laser, vitreous surgery or intravitreal injections [5].
Development of chronic diseases including diabetes mellitus is provoked by oxidative stress. The main characteristic of this disease is an elevated level of glucose and its chronicity will increase the output of reactive oxygen species and lead to generation of pancreatic islet cells oxidative stress. The ß- cells demonstrate reduced levels of antioxidant enzymes and subsequently are more liable to oxidative stress [10].
Reactive oxygen species dampen pancreatic ß-cell insulin production and its control through destructive effects on mitochondrial performance. There is evidence that reactive oxygen species injury is correlated with diabetic microvascular and macro vascular sequelae. Raised blood glucose level and oxidative stress are the main causes of diabetic complications. These complications manifest through raised reactive oxygen species by the mitochondrial system. Certain research reported that antioxidants have a crucial function in oxidative stress induced glucotoxicity, where hyperglycemia save insulin gene expression [11].
Diabetic oxidative stress and apoptosis are significantly linked with impaired energy maintenance and functions of mitochondria in the cells. Increased diabetic oxidative stress is assumed to boost myocardial damage, retinopathy, nephropathy and neuropathy. Oxidative stress develops such complications include autoxidation of glucose, decreased concentration glutathione and vitamin E in the tissues and deteriorated activation of superoxide dismutase and catalase. The retina is characterized by increased polysaturated fatty acids concentration with maximum oxygen uptake and glucose oxidation. Hence, the retina is more liable to oxidative stress. High blood glucose, oxidative stress and altered homeostasis are essential for the pathogenesis of diabetic retinopathy. Oxidative stress participates to the development of diabetic retinopathy and its resistance even with ideal glycemic control. Diabetic retinopathy resistance is due damaged reactive oxygen species accumulation [12].
The gut microbiota presents a key function in protecting physical and biochemical safety of intestinal wall [13]. The human gut steward more than 100 trillion bacteria belonging to more than 1,000 species. The gut microbiome carries out several trophic, metabolic and protective functions on the host with a size exceeding a human genome by 100-fold. Intestinal microbiome functions like virtual organ system and is composed of around 200 common species and 1,000 less prevalent ones [14].
Disparity of composition of gut microbiota may be based on affection to diet, host genetics and the immune status [13]. Bacteroidetes, firmicutes and actinobacteria compose more than 95% of total microbiota. Gut microbiota core functions are almost the same in all human beings but they differ in specialized ones. As a result, some communities correlate to human diseases and obesity more than others [15].
Disparity of composition of gut microbiota may be based on affection to diet, host genetics and the immune status [13]. Bacteroidetes, firmicutes and actinobacteria compose more than 95% of total microbiota. Gut microbiota core functions are almost the same in all human beings but they differ in specialized ones. As a result, some communities correlate to human diseases and obesity more than others [15].
Intestinal microbiota is incorporated in the development of obesity through process of energy harvest. Some studies reported, that intestinal microbiota is essential for the development of host immunity [16]. Type 2 diabetes mellitus assumed to be the most concerned obesity-related disorder and thus its association with body fat anomalous energy metabolism and low-grade chronic inflammation. Some assumptions have suggested the correlation of Type 2 diabetes mellitus with intestinal microbiota existence [17].
Fundamentally, intestinal microbiota has an essential role in the progression of prediabetes cases, like insulin resistance. Overweight and obese people suffering from insulin resistance were reported with altered configuration of gut microbiota, especially raised ratio of Firmicutes/Bacteroidetes relative to healthy people [18]. Thus, it is proposed that changed microbiota in fatness adjusts permeability of intestinal wall and elevates metabolic endotoxin production causing chronic low-grade inflammation, insulin resistance and type 2 diabetes mellitus [19].
Diabetic retinopathy affects 60% of non-insulin dependent diabetes mellitus patients [20]. Intestinal Gram-positive bacteria and coagulase concentration are higher in diabetic patients particularly those with diabetic retinopathy [21]. This fact was approved by Bilen, et al., who proved that Staphylococcus epidermidis and aureus were the predominant conjunctival pathogens in type 2 diabetes mellitus patients and Staphylococcus aureus isolated from the patients’ eyes were different in frequency compared to type 1 diabetes mellitus [22]. The study aimed to detect early macular and peripapillary nerve fiber layer changes in diabetic patients, to screen for selected serum biomarkers which might predict the future development of retinopathy in type 2 diabetes mellitus patients and to detect and identify the pattern of impaired gut microbiota in patients with and without diabetic retinopathy in comparison with normal healthy people using microbiological tools.
Materials and Methods
A total of 39 subjects matched for age and sex were hired from King Saud university campus and tertiary hospital in the period between August 2022 till June 2023. Healthy and diabetic subjects free or suffering from retinopathy, age ranged 40-60 years were examined in this cross-sectional, case-control study. Subjects with any systemic disease, ocular pathology and past ocular surgery were excluded.
They were classified into 3 groups: Group 1: consisted of 30 normal eyes of 15 subjects, Group 2: consisted of 24 eyes of 12 diabetic patients free of retinopathy, Group 3: consisted of 23 eyes of 12 diabetic patients showing retinopathy in different stages.
All subjects underwent (1) complete ophthalmological examination in the form of : 1. Measurement of refraction using Auto Refractometer, 2. Vision using Snellen chart, 3. Anterior segment examination by Slit lamp, 4. Posterior segment examination by indirect ophthalmoscopy for retinopathy diagnosis, 5. Nerve fiber layer thickness centered on optic disc and macular using 3D- 2000 spectral domain OCT. (2) Biochemical analysis of collected overnight fasting plasma of the following markers were performed (Vitamin C, glutathione, lipid peroxidase and Glutathione S transferase) and (3) microbial examination: identification of large number of gut microbiota directly from feces using bacterial screening on culture media and PCR (Polymerase Chain Reaction).
Statistical Analysis
Graph Pad Prism software version 7.0b (2016) were used for data analysis. Data were represented as mean ± standard deviation and different variables were matched using one-way Analysis of Variance (ANOVA). Bacteriod levels in different groups were matched using Krsukal-Wallis as non-parametric test then by Dunn’s post-test. A P-value of ≤ 0.05 was estimated to be statistically significant.
Results
OCT Results
Table 1 shows the subjects characteristics of 15 controls (group 1) and 24 diabetics 12 free and 12 suffering from retinopathy (group 2 and 3 respectively). Intraocular pressures and visual acuity that might influence NFL thickness were different statistically between group 1 and 3 (P = 0.0247 and 0.0210 respectively).
Variables | Group 1 | Group 2 | Group 3 | |
Age (years) mean±SD (Range) | 47.2±4.69 | 46.83±6.14 | 52.41±6.34 | |
Duration of DM (years) | – | 7.5±8.14 | 12.58±8.08 | |
IOP (mmHg) | 17.86±3.62 | 18.5±2.85 | 20.20±2.65* | |
Visual acuity (log Mar) | 0.08±0.21 | 0.06±0.12 | 0.24±0.34* | |
Refractive error (diopters) | -1.08±2.84 | – 0.61±1.31 | -4.97±15.48 | |
*Significant compared to control (P≤0.05) | ||||
Table 1: Demographic characteristics of participants.
The peripapillary nerve fiber layer thickness measured in all quadrants superiorly, temporally, inferiorly and nasally for the three groups using 3D- OCT 2000 showed no significant difference statistically among groups. The nerve fiber layer analysis data for all groups are shown in Table 2.
Group 1 (n=30 Eyes) | ||||
Variables | Mean ±SD | 5thPercentile | Median | 95th Percentile |
Superior | 129.6±29.18 | 135 | 135 | 165.95 |
Temporal | 83.6±21.08 | 81 | 81 | 125.55 |
Inferior | 132.43±18.83 | 135 | 135 | 156.1 |
Nasal | 77.1±17.69 | 80.5 | 80.5 | 105.25 |
Group 2 (n=24 Eyes) | ||||
Superior | 124.66±24.94 | 128.5 | 128.5 | 149.7 |
Temporal | 82.83±19.26 | 77 | 77 | 123.4 |
Inferior | 133.70±36.63 | 137 | 137 | 177.6 |
Nasal | 72.58±20.88 | 73.5 | 73.5 | 97.55 |
Group 3 (n=23 Eyes) | ||||
Superior | 124.43±51.89 | 130 | 130 | 198.9 |
Temporal | 84.13±39.96 | 74 | 74 | 156.7 |
Inferior | 138.17±37.22 | 134 | 134 | 190.8 |
Nasal | 84.34±46 | 82 | 82 | 132.6 |
Table 2: Retinal nerve fiber layer thickness around the optic disc (µm) in the 3 studied groups.
The macular total retinal thickness measured using 3D- OCT 2000 are demonstrated in Table 3. It was different between groups with tendency to be increased in group 3 due to diabetic retinopathy. However, by comparing the macular thickness in the four quadrants we found no statistical difference except in the inferior quadrant. Mean of central, superior, temporal and nasal macular thickness was not different significantly between groups (P= 0.532, 0.124, 0.051 and 0.309 respectively). Only the inferior quadrant macular thickness in non DR group was significantly difference as compared control (P= 0.004) (Fig. 1).
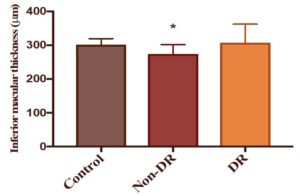
Figure 1: Inferior macular thickness among 3 groups.
Group 1 (n=30 Eyes) | ||||
Variables | Mean ±SD | 5thPercentile | Median | 95th Percentile |
Central | 233.3±34.76 | 228 | 228 | 294.45 |
Superior | 302.83±15.48 | 304 | 304 | 320.55 |
Temporal | 298.9±21.06 | 294.5 | 294.5 | 321.65 |
Inferior | 301.76±17.62 | 299.5 | 299.5 | 331.9 |
Nasal | 295.53±16.79 | 297 | 297 | 317.1 |
Group 2 (n=24 Eyes) | ||||
Central | 235.12±34.26 | 234.5 | 234.5 | 297.9 |
Superior | 288±27.03 | 289.5 | 289.5 | 336.8 |
Temporal | 280.16±27.29 | 284.5 | 284.5 | 318.7 |
Inferior | 274.79±27.29* | 276.5 | 276.5 | 306.7 |
Nasal | 284.37±24.96 | 286 | 286 | 317.1 |
Group 3 (n=23 Eyes) | ||||
Central | 245.47±53 | 236 | 236 | 332.3 |
Superior | 294±35.74 | 291 | 291 | 359 |
Temporal | 302.69±49.66 | 286 | 286 | 403.5 |
Inferior | 308±54.53 | 293 | 293 | 446 |
Nasal | 291.86±36.77 | 289 | 289 | 343.6 |
Table 3: Retinal macular thickness (µm) in the 3 studied groups.
Biochemical Analysis Results
Glutathione S Transferase (GST) Activity
The glutathione levels comparison between groups shows no significant difference either between diabetic and control or diabetic with and without retinopathy (Fig. 2).
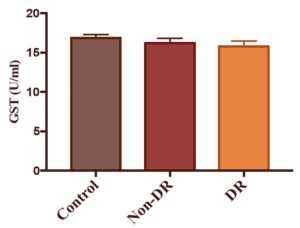
Figure 2: Glutathione S transferase among 3 groups.
Vitamin C
Revealed a significant difference between diabetic and control subjects with p-value≤ 0.05. The unexpected rise of vitamin c is attributed to intake of vitamin c supplement together with metformin (oral hypoglycemic drug) (Fig. 3).
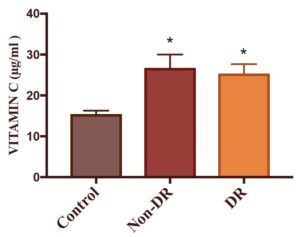
Figure 3: Vitamin C among 3 groups.
Lipid Peroxides
Analysis of lipid peroxide between the groups show no significant difference (Fig. 4).
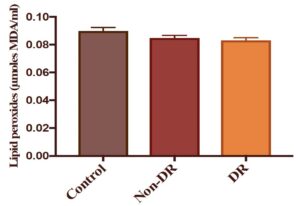
Figure 4: Lipid peroxides among 3 groups.
Glutathione
Displayed a significant difference among groups where p-value ≤ 0.05, (Fig. 5).
Glutathione S transferase and lipid peroxide levels showed insignificant differences between studied groups; however, vitamin C and glutathione levels were raised in diabetics compared to controls. Lipid peroxides and oxidative stress are changed as there are evidence that multivitamins and statins can reverse these consequences.
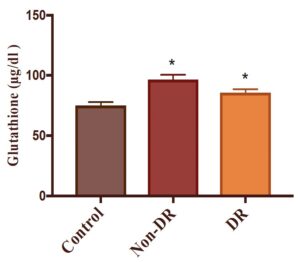
Figure 5: Glutathione level among groups.
Microbiological Results
The most significant media that were analyzed is for the bacteroids and it shows significant difference between controls and diabetic retinopathy (Fig. 6). It is clear that over growth of bacteroids is contributed to the development of DR in diabetic patients.
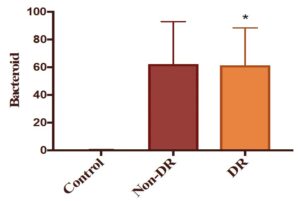
Figure 6: Level of bacteriods growth among 3 groups.
Discussion
Retinal nerve fiber loss develops before clinically detectable retinopathy in diabetic patients and deteriorates with advanced disease severity. Hence optical coherence tomography is helpful for early diagnosis of diabetic retinopathy.
Our results revealed, the peripapillary nerve fiber layer thickness measured in all quadrants superiorly, temporally, inferiorly and nasally for the three groups using 3D- OCT 2000 showed no significant difference statistically among groups. The macular total retinal thickness was different between groups with tendency to be increased in group 3 due to diabetic retinopathy. However, by comparing the macular thickness in the four quadrants we found no statistical difference except in the inferior quadrant. Table 4 demonstrates discussion with previous studies.
Study | Number of subjects | Mean age (years) | Region | Results |
Current study | Normal:15 Diabetic:12 Diabetic Retinopathy:12
| 47.2±4.69 46.8±6.14 52.4±6.34 | KSU female campus, KAUH, KSA. | The NFL thickness around the optic disc show no significant difference in all quadrants, while the macular thickness revealed significant difference in inferior quadrant between groups. |
El-Hifnawy, et al., 2016 | Normal:20 Diabetic:20 Diabetic retinopathy:30 | 47.80±10.47 52.90±5.11 52.33±8.82 | Alexandria Main University Hospital | The global, superior and temporal retinal nerve fiber layer thickness in diabetic patients without diabetic retinopathy was significantly lower than that of control group and that of patients with non-proliferative retinopathy [23]. |
Park, et al., ,2011 | Normal:40 Diabetic:37 Diabetic retinopathy:89
| 64.3±6.7 66.2±7.2 65.8±4.9 | Catholic university, Korea | As the severity of diabetic retinopathy progressed, the mean, superior, temporal, inferior and nasal nerve fiber layer thickness tend to become thinner. However, only the macular nasal nerve fiber layer thickness of the superior quadrant differed significantly among the groups and especially between the control and non-diabetic retinopathy groups [24]. |
Choplin, et al., 2006 | Normal:50 Diabetic:128
| 66.2±9.4 65.1±6.9
| Senshokai Eye Institute, Kyoto, Japan
| The retinal nerve fiber layer thickness in patients with diabetes mellitus was reduced significantly compared with age-matched normal control eyes (P < .01) [25]. |
Faria, et al., 2002 | Normal:12 Diabetic (type 1):12
| 29±6 30±7.5 | Hospital of the state university of Campinas, Brazil | The peripapillary retinal fiber layer thinning in superior quadrant compared to controls (p=0.007) [26]. |
Table 4: Discussion with previous studies.
Conclusion
Our results succeeded to reveal that, the peripapillary nerve fiber layer thickness was different among groups but statistically insignificant and the macular total retinal thickness was different between groups with tendency to be increased in group 3 due to diabetic retinopathy. As hyperglycemia and oxidative stress are implicated in the etiological pathology of diabetic retinopathy, the current study certified that different treatment options that reduce oxidative stress can delay progressive damage in controlled type 2 diabetics.
Clinical Modulation
Oxidative stress is integrated in pathogenesis and advancement of diabetic retinopathy in both types of diabetes. Recognizing efficacious modalities for retinopathy prevention and early intervention, is essential to maintain vision. Therefore, clinical treatment of oxidative stress can be implemented in preventing visual loss caused by diabetic retinopathy. Hyperglycemia is combined with many pathophysiological mechanisms that aggravate diabetic retinopathy. Different methods should be fixed on to manage diabetic retinopathy including oxidative stress-related medication that can stabilize the retinopathy stage in uncontrolled non-insulin diabetics.
Recommendation
Executing properly designed small studies impose precise analysis. Because small studies may grant rapid results, it was mandatory to give strong evidence that oxidative stress may endanger diabetic retinopathy, whether the results are positive or not. Moreover, data collected from our studies might be used to perform larger affirming studies taking into consideration limitations of small studies.
Conflicts of Interest
The authors declare no conflict of interest.
Funding
This research project was supported by a grant from the Research Center of the Centre for Female Scientific and Medical Colleges Deanship of Scientific Research, King Saud University.
Institutional Review Board Statement
The study was conducted according to the guidelines of the Declaration of Helsinki and approved by the Institutional Review Board, of health sciences colleges research on human subjects, College of medicine, King Saud University.
Informed Consent Statement
Informed written consent was obtained from all subjects involved.
Data Availability Statement
The datasets used and analyzed during the current study are available from the corresponding author upon reasonable request.
Data Availability Statement
The datasets used and analyzed during the current study are available from the corresponding author upon reasonable request.
References
- American Diabetes Association. Diabetes Care. 2010.
- AM A. History of diabetes mellitus. Saudi Med J. 2002;23:373-8.
- American Diabetes Association. Diagnosis and classification of diabetes mellitus. Diabetes Care. 2010;62-9.
- Sarwar NGP. Emerging risk factors collaboration.: diabetes mellitus, fasting blood glucose concentration, and risk of vascular disease: a collaborative meta-analysis of 102 prospective studies. The Lancet. 2010;375(9733):2215-22.
- Martin MM. Diabetic retinopathy- ocular complication of diabetes mellitus. World journal of Diabetes. 2015;6(3):489-99.
- Zheng YH. The worldwide epidemic of diabetic retinopathy. Ind J Ophthalmol. 2012;428-31.
- Jones SA. Diabetic retinopathy screening: a systemic review of the economic evidence. Diabetic Med. 2010;249-56.
- Alan WNL. Advances in our understanding of diabetic retinopathy. Clinical Sci. 2013;1-17.
- Wessel MM, Aaker GD, Parlitsis G, Cho M, D’Amico DJ, Kiss S. Ultra-wide-field angiography improves the detection and classification of diabetic retinopathy. Retina. 2012;32(4):785-91.
- Poitout V, Robertson RP. Glucolipotoxicity: fuel excess and β-cell dysfunction. Endocrine Rev. 2008;29(3):351-66.
- Savu O, Ionescu-Tirgoviste C, Atanasiu V, Gaman L, Papacocea R, Stoian I. Increase in total antioxidant capacity of plasma despite high levels of oxidative stress in uncomplicated type 2 diabetes mellitus. J Int Medical Res. 2012;40(2):709-16.
- Rahimi-Madiseh M, Malekpour-Tehrani A, Bahmani M, Rafieian-Kopaei M. The research and development on the antioxidants in prevention of diabetic complications. Asian Pacific J Tropical Med. 2016;9(9):825-31.
- Benson AK, Kelly SA, Legge R, Ma F, Low SJ, Kim J, et al. Individuality in gut microbiota composition is a complex polygenic trait shaped by multiple environmental and host genetic factors. Proceedings of the National Academy of Sci. 2010;107(44):18933-8.
- Turnbaugh PJ, Ridaura VK, Faith JJ, Rey FE, Knight R, Gordon JI. The effect of diet on the human gut microbiome: a metagenomic analysis in humanized gnotobiotic mice. Science Translational Medicine. 2009;1(6):6ra14.
- Gerritsen J, Smidt H, Rijkers GT, de Vos WM. Intestinal microbiota in human health and disease: the impact of probiotics. Genes Nutrition. 2011;6:209-40.
- Round JL, Mazmanian SK. The gut microbiota shapes intestinal immune responses during health and disease. Nature Rev Immunol. 2009;9(5):313-23.
- Lee J. Adipose tissue macrophages in the development of obesity-induced inflammation, insulin resistance and type 2 diabetes. Arch Pharmacal Res. 2013;36:208-22.
- Tilg H, Kaser A. Gut microbiome, obesity, and metabolic dysfunction. The J Clin Invest. 2011;121(6):2126-32.
- Everard A, Cani PD. Diabetes, obesity and gut microbiota. Best Prac Res Clin Gastroenterol. 2013;27(1):73-83.
- Fong DS, Aiello LP, Ferris III FL, Klein R. Retinopathy in diabetes. Diabetes Care. 2004;84-7.
- Martins EN, Alvarenga LS, Höfling-Lima AL, Freitas D, Zorat-Yu MC, Farah ME, et al. Aerobic bacterial conjunctival flora in diabetic patients. Cornea. 2004;23(2):136-42.
- Bilen H, Ates O, Astam N, Uslu H, Akcay G, Baykal O. Conjunctival flora in patients with type 1 or type 2 diabetes mellitus. Adv Therapy. 2007;24:1028-35.
- El-Hifnawy MA, Sabry KM, Gomaa AR, Hassan TA. Effect of diabetic retinopathy on retinal nerve fiber layer thickness. Delta J Ophthalmol. 2016;17(3):162-6.
- Park HY, Kim IT, Park CK. Early diabetic changes in the nerve fibre layer at the macula detected by spectral domain optical coherence tomography. British J Ophthalmol. 2011;95(9):1223-8.
- Choplin NT. Diabetes-associated retinal nerve fiber damage evaluated with scanning laser polarimetry. Am J Ophthalmol. 2006;142(6):1093.
- De Faria JL, Russ H, Costa VP. Retinal nerve fibre layer loss in patients with type 1 diabetes mellitus without retinopathy. British J Ophthalmol. 2002;86(7):725-8.
Article Type
Research Article
Publication History
Received Date: 04-05-2024
Accepted Date: 23-05-2024
Published Date: 01-06-2024
Copyright© 2024 by Fahmy RM, et al. All rights reserved. This is an open access article distributed under the terms of the Creative Commons Attribution License, which permits unrestricted use, distribution, and reproduction in any medium, provided the original author and source are credited.
Citation: Fahmy RM, et al. Linkage of Diabetic Retinopathy with Blood Antioxidants and Gut Microbiota in Type Two Diabetes Mellitus Saudi Patients. J Ophthalmol Adv Res. 2024;5(2):1-11.

Figure 1: Inferior macular thickness among 3 groups.

Figure 2: Glutathione S transferase among 3 groups.

Figure 3: Vitamin C among 3 groups.

Figure 4: Lipid peroxides among 3 groups.

Figure 5: Glutathione level among groups.

Figure 6: Level of bacteriods growth among 3 groups.
Variables | Group 1 | Group 2 | Group 3 |
|
Age (years) mean±SD (Range) | 47.2±4.69 | 46.83±6.14 | 52.41±6.34 |
|
Duration of DM (years) | – | 7.5±8.14 | 12.58±8.08 |
|
IOP (mmHg) | 17.86±3.62 | 18.5±2.85 | 20.20±2.65* |
|
Visual acuity (log Mar) | 0.08±0.21 | 0.06±0.12 | 0.24±0.34* |
|
Refractive error (diopters) | -1.08±2.84 | – 0.61±1.31 | -4.97±15.48 |
|
*Significant compared to control (P≤0.05) | ||||
Table 1: Demographic characteristics of participants.
Group 1 (n=30 Eyes) | ||||
Variables | Mean ±SD | 5thPercentile | Median | 95th Percentile |
Superior | 129.6±29.18 | 135 | 135 | 165.95 |
Temporal | 83.6±21.08 | 81 | 81 | 125.55 |
Inferior | 132.43±18.83 | 135 | 135 | 156.1 |
Nasal | 77.1±17.69 | 80.5 | 80.5 | 105.25 |
Group 2 (n=24 Eyes) | ||||
Superior | 124.66±24.94 | 128.5 | 128.5 | 149.7 |
Temporal | 82.83±19.26 | 77 | 77 | 123.4 |
Inferior | 133.70±36.63 | 137 | 137 | 177.6 |
Nasal | 72.58±20.88 | 73.5 | 73.5 | 97.55 |
Group 3 (n=23 Eyes) | ||||
Superior | 124.43±51.89 | 130 | 130 | 198.9 |
Temporal | 84.13±39.96 | 74 | 74 | 156.7 |
Inferior | 138.17±37.22 | 134 | 134 | 190.8 |
Nasal | 84.34±46 | 82 | 82 | 132.6 |
Table 2: Retinal nerve fiber layer thickness around the optic disc (µm) in the 3 studied groups.
Group 1 (n=30 Eyes) | ||||
Variables | Mean ±SD | 5thPercentile | Median | 95th Percentile |
Central | 233.3±34.76 | 228 | 228 | 294.45 |
Superior | 302.83±15.48 | 304 | 304 | 320.55 |
Temporal | 298.9±21.06 | 294.5 | 294.5 | 321.65 |
Inferior | 301.76±17.62 | 299.5 | 299.5 | 331.9 |
Nasal | 295.53±16.79 | 297 | 297 | 317.1 |
Group 2 (n=24 Eyes) | ||||
Central | 235.12±34.26 | 234.5 | 234.5 | 297.9 |
Superior | 288±27.03 | 289.5 | 289.5 | 336.8 |
Temporal | 280.16±27.29 | 284.5 | 284.5 | 318.7 |
Inferior | 274.79±27.29* | 276.5 | 276.5 | 306.7 |
Nasal | 284.37±24.96 | 286 | 286 | 317.1 |
Group 3 (n=23 Eyes) | ||||
Central | 245.47±53 | 236 | 236 | 332.3 |
Superior | 294±35.74 | 291 | 291 | 359 |
Temporal | 302.69±49.66 | 286 | 286 | 403.5 |
Inferior | 308±54.53 | 293 | 293 | 446 |
Nasal | 291.86±36.77 | 289 | 289 | 343.6 |
Table 3: Retinal macular thickness (µm) in the 3 studied groups.
Study | Number of subjects | Mean age (years) | Region | Results |
Current study | Normal:15 Diabetic:12 Diabetic Retinopathy:12
| 47.2±4.69 46.8±6.14 52.4±6.34 | KSU female campus, KAUH, KSA. | The NFL thickness around the optic disc show no significant difference in all quadrants, while the macular thickness revealed significant difference in inferior quadrant between groups. |
El-Hifnawy, et al., 2016 | Normal:20 Diabetic:20 Diabetic retinopathy:30 | 47.80±10.47 52.90±5.11 52.33±8.82 | Alexandria Main University Hospital | The global, superior and temporal retinal nerve fiber layer thickness in diabetic patients without diabetic retinopathy was significantly lower than that of control group and that of patients with non-proliferative retinopathy [23]. |
Park, et al., ,2011 | Normal:40 Diabetic:37 Diabetic retinopathy:89
| 64.3±6.7 66.2±7.2 65.8±4.9 | Catholic university, Korea | As the severity of diabetic retinopathy progressed, the mean, superior, temporal, inferior and nasal nerve fiber layer thickness tend to become thinner. However, only the macular nasal nerve fiber layer thickness of the superior quadrant differed significantly among the groups and especially between the control and non-diabetic retinopathy groups [24]. |
Choplin, et al., 2006 | Normal:50 Diabetic:128
| 66.2±9.4 65.1±6.9
| Senshokai Eye Institute, Kyoto, Japan
| The retinal nerve fiber layer thickness in patients with diabetes mellitus was reduced significantly compared with age-matched normal control eyes (P < .01) [25]. |
Faria, et al., 2002 | Normal:12 Diabetic (type 1):12
| 29±6 30±7.5 | Hospital of the state university of Campinas, Brazil | The peripapillary retinal fiber layer thinning in superior quadrant compared to controls (p=0.007) [26]. |
Table 4: Discussion with previous studies.


