Ignacio Diez Lopez¹*, Sandra Maeso Mendez2, Gaspar Sánchez Merino3
¹Basque Country University, Pediatric Department, Victory, Spain
²Child and Adolescent Endocrinology Unit, Pediatric Department, OSI Araba, Osakidetza Vitoria, Spain
³Coordinator of the Innovation Platform-IIS BIOARABA, Victory, Spain
*Corresponding author: Ignacio Diez Lopez, Basque Country University, Pediatric Department, Victory, Spain; Email: [email protected]
Published Date: 04-11-2024
Copyright© 2024 by Diez-Lopez I, et al. All rights reserved. This is an open access article distributed under the terms of the Creative Commons Attribution License, which permits unrestricted use, distribution, and reproduction in any medium, provided the original author and source are credited.
Abstract
Big data tools are currently a major tool for assessing population changes. There is a causal relationship between low economic levels and a higher prevalence of conditions associated with malnutrition and obesity. One of the causes of low income in different areas could be a higher unemployment rate and a confluence of people who are migrating for economic reasons.
Objective: To assess in a child population the effect of the unemployment rate, average income and immigration rate as a possible effect of increasing the prevalence of malnutrition associated with childhood obesity.
Material and methods: Data collected from computerized clinical history episodes, studying the variables of sex, age, weight, height, of a pediatric population (year 2022), comparing it with the average income of their residential district, unemployment rate and immigration rate. Use of big data methods for the study of variables.
Using the Cole-Green LMS algorithm with penalized likelihood, implemented in the RefCurv 0.4.2 software (2020), which allows managing large amounts of data. The hyperparameters have been selected using the BIC (Bayesian Information Criterion).
To calculate population deviations from the reference, the reference was taken as being above 1.5 standard deviations from the average according to age.
Results: 66,975 computerised episodes of children under 16 years of age and a total of 1,205,000 variables studied. The data and comparative graphs between districts of the population studied are represented with respect to the variables analysed. There are significant differences, with an increase in the rate of overweight in those areas with lower economic income and higher unemployment and immigration rates.
Big data technology allows for more efficient population studies, selecting populations most in need of health intervention, optimizing scarce health resources.
Keywords: Big Data; Children Obesity; Social Determinants
Ethical Approval Number: CEIC OSI ARABA Approval Expte 2022-058
Introduction
In epidemiology, a revealing piece of information about the health status of a population is knowing their weight and height. So much so that most countries consider in their health programs to carry out checks on children throughout childhood to assess their growth and development status [1-3]. The Body Mass Index (BMI) is a common parameter to calculate and assess the degree of overweight, whether or not it is a criterion of health [3]. Childhood overweight has been seen to increase in the last decade in all regions of the world [4,5].
Most countries use longitudinal population studies, which are by nature long, expensive and have a limited number of subjects.
In Spain, the tables of Carrascosa, et al., are widely adapted [6].
Electronic medical records collect multiple variables in clinical practice, including anthropometric and sociodemographic data.
Different statistical techniques, such as machine learning, allow the exploitation of these data from a large number of cases in an almost semi- automated way, providing data of great statistical value. This group of authors (Diez Lopez, et al.,) published how the use of these methods would allow population studies to be carried out with greater statistical power than classic longitudinal studies [7].
There are various studies that correlate obesity, especially childhood obesity, with the most disadvantaged sectors of society [8]. Although there are studies on this subject in different countries and even international series, there are no, at least in our environment and nearby population, studies on this subject; nor in any case has the use of new BIG DATA techniques been described for these studies [8,9].
The causes of the higher prevalence of obesity in the most disadvantaged strata have been postulated as diverse, from decreased physical activity, overeating, less education, use of lower-cost and higher-calorie foods [8,9]. The demographic challenges facing Western countries today include not only the classic ones, such as unemployment, but also the integration of the most disadvantaged groups, such as immigrants, into their population, who generally have a lower income level.
Goals
Main Objective
To describe the situation of the prevalence of overweight in the pediatric population of our area, Álava, Basque Country, Spain, using a new big data approach in relation to the place of residence and the unemployment rate, average income per person and rate of immigrant population in said district or neighborhood. To compare whether there are differences in the BMI variable (kg/m2) by comparing paired means between districts and neighborhoods.
Material and Methods
Design
This is a population-based cross-sectional study.
Study Population
All minors under 18 years of age being followed up in the Basque health system, OSAKIDETZA, who present weight and height records in the electronic clinical history tool of OSABIDE GLOBAL in the Alava area.
Inclusion Criteria
- Both sexes
- Ages between 0 and 18 years
- Be registered or present a registered address
Exclusion criteria:
- Not having data registered in the GLOBAL
Epidemiological Data
source is used on the variables average income per inhabitant, unemployment rate and immigration rate by district/neighborhood.
Available at: https://www.eustat.eus/bankupx/pxweb/es/DB/-/PX_010154_cepv1_ep06b.px/table/tableViewLayout1/ .
By including the entire registered pediatric population, it is considered that it is not necessary to calculate the sample size. Data is recorded between 01/01/2022 and 30/03/2022.
Variables
- Main variables:
- Weight ( Kgrs )
- Size (cm)
- Gender (Male, Female, Binary)
- Age (expressed in years and months)
- Date of registration
- Place of residence – district/neighborhood code
- Unemployment rate, per capita income and immigration rate by district
Data Management Plan
A data protection impact assessment has been prepared. The data life cycle will involve the IT service of OSI Araba, the project’s principal investigator and collaborating researchers, including professionals from the Basque Center for Applied Mathematics (BCAM) who are part of the research team (Fig. 1). There is a collaboration agreement between BCAM and the Bioaraba Health Research Institute. The method already described by Diez- Lopez, et al., is followed [7].
Statistical Analysis
Lopez, et al., is followed based on the Dirichlet processes (Dirichlet Process, DP) [7,10]. In this project we will adopt this approach that allows to build Gaussian mixture models (GM) [7,11]. In addition, Gaussian averaging models based on Dirichlet processes (Dirichlet) are used. process Gaussian mixture models, DPGMM).
Gaussian averaging models based on hierarchical Dirichlet processes (Hierarchical Dirichlet). Dirichlet process Gaussian mixture model, HDPGMM) [12].
Specifically, by grouping the data according to the different variables, clusters will be obtained that will inform us about the somatometric similarities and differences of the population based on the somatometric variables and the district in which they live, incorporating recent methodological innovations on databases similar to ours already described [7,13-16]. The BMI is calculated as weight/height2 (kg /m2). These data are compared with the means and SDS of the studies published to date and reference of our population [6]. Overweight is defined as +1.5 SDS with respect to the normal reference for age and sex.
Results
Data has been obtained from a total of 67,270 minors. The sum of all variables studied (some presented in this work and others reserved) amounts to 1,749,020 variables. We present in various tables the results obtained by sex, age and BMI and other variables.
Data from the National Institute of Statistics and EUSTAT indicate that 338,765 people live in our territory. Of these inhabitants, 166,437 are men and 172,328 are women. In addition, 52,241 of these people were born abroad. In the last year, our territory has gained 3,199 foreign-born inhabitants: a number higher than the total population growth.
If we consider the continent of nationality, those from American countries account for 44.1% of people with foreign nationality. The countries in this group that contribute the most people are Colombia, Nicaragua, Honduras, Venezuela and Paraguay, which account for 29.6% of the total number of people with foreign nationality and 67.1% of people with American nationality. If we differentiate by sex, we have that 50.1% of people with foreign nationality and 58.8% of people with American nationality are women. African countries account for 25.1% of the foreign population, with more than half of them from Morocco (54.1%). Next come Algeria, Senegal and Nigeria, with 13.4%, 10.4% and 8.1%, respectively. These four nationalities account for more than 86% of people with African nationality and more than 21% of the total number of foreign nationals. People of European nationality residing in the Basque Country represent 22.8% of the total number of foreigners. Romania stands out in this group, accounting for 9.1% of the total number of foreigners and 40% of Europeans. In second place, although at a considerable distance, is Portugal with 13.4% of the people (Source EUSTAT https://www.eustat.eus/bankupx/pxweb/es/DB/-/PX_010154_cepv1_ep06b.px/table/tableViewLayout1/).
Although the rate of immigrants in the Basque Country is on average 13% of the total population, there are significant differences between districts (Source EUSTAT), with the towns of Álava having the highest average percentage of immigrants of the entire population of the region. Vitoria is the Basque region with the highest percentage of immigrants in its population, with more than 15%, followed by the Guipuzcoan Bajo Bidasoa, with 14.1%. There are towns in the so-called Rioja Alavesa with more than 20%.
In terms of percentages, the level of immigration in Álava stands out, with 15.1% of the total population of the Basque Country and 17.8% of citizens of foreign origin. In Gipuzkoa the distribution is balanced (32.8% of the total population and 32.9% of immigrants) and in Bizkaia it is lower (52.0% of the Basque population and 49.3% of immigrants residing in Euskadi) (Fig. 1).
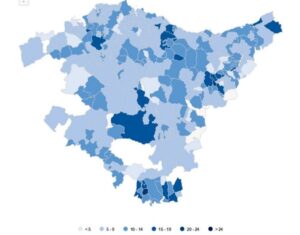
Figure 1: Representation of the rate of people of foreign origin living in the territory of the Basque Country in % according to district. Color code. Source EUSTAT 2023.
Average income in the Basque Country. The disposable income, calculated as the total income minus income tax and social security contributions paid by workers, of the resident population in 2021 is 19,366 euros. There are significant differences between age groups, sex and districts. The income of minors depends on the average family income. The average family income of the Basque Country is 47,005 euros in 2021. Total family income is obtained by aggregating the personal income of family members, including minors. The average income for all families in the Basque Country is around double the average personal income. There are significant differences between districts (Source EUSTAT), with the towns of Álava having the lowest average income of the entire population of the region (Fig. 2).

Figure 2: Representation of capita income expressed in euros/year by district of the Basque Country territory in %. Color code. Source EUSTAT 2023.
The unemployment rate in the Basque Country is 7.5%, well below the average for the country, Spain. Although 6 out of 10 households have all their people employed, in more than 1 out of 10 they are all unemployed. There are significant differences between districts (Source EUSTAT), with some towns in Álava and Vizcaya having the highest unemployment rate (Fig. 3).
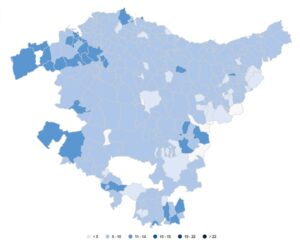
Figure 3: Representation of the unemployment rate expressed as a % of the active population according to districts of the Basque Country in %. Color code. Source EUSTAT 2023.
Based on the above, it is clear that the territory under study is the one with the lowest per capita income, the highest prevalence of migrants and some of the areas most affected by structural unemployment. At the same time, within the territory we have studied, Álava, there are significant differences between different districts. If we focus on the BMI data, establishing as a significant cut-off point those that exceed more than 10% of the entire population affected by obesity, differences are evident between districts within the territory of Alava (Table 1).
Women in 2022 – % of population with BMI>1.5 SDS by neighborhood or district | ||||
DISTRICT | % | No. of samples | ||
Saint Martin | 7.58 | 541 | ||
OLAGUIBEL | 7.38 | 542 | ||
ZABALGAÑA | 8.22 | 1386 | ||
OLARIZU | 6.32 | 364 | ||
SALBURUA | 6.37 | 832 | ||
ARABIZKARRA I | 6.53 | 199 | ||
OLD TOWN GASTEIZ | 10,20 | 330 | ||
LOWER RIVER BAY (RIVABELLOSA) | 4.35 | 23 | ||
SANSOMENDI | 5 | 36 | ||
ABETXUKO | 17,28 | 81 | ||
GAZALBIDE TXAGORRITXU | 11.25 | 329 | ||
Urcabustaiz (Izarra) | 2.22 | 45 | ||
Zuya (Murgia) | 6.25 | 48 | ||
LAKUABIZKARRA | 8.06 | 1240 | ||
ARABIZKARRA II | 9.72 | 257 | ||
JOY OF ALAVA (DULANTZI) | 12.5 | 80 | ||
HAVANA | 6.49 | 185 | ||
IRUÑA DE OCA (NANCLARES) | 3.95 | 76 | ||
LAKUA | 5.81 | 396 | ||
ZIGOITIA (GOPEGI) | 0 | 36 | ||
SALVATIERRA (AGURAIN) | 7.36 | 163 | ||
OTXANDIO | 10.71 | 28 | ||
ZARAMAGA | 15.47 | 362 | ||
LABASTIDA | 11.47 | 61 | ||
OION | 6.55 | 168 | ||
LEGUTIANO (VILLARREAL) | 12.5 | 32 | ||
LAGUARDIA | 2.97 | 101 | ||
Men year 2022 – – % population with BMI>1.5 SDS by neighborhood or district | ||||
DISTRICT | % | No. of samples | ||
Saint Martin | 5.13 | 546 | ||
OLAGUIBEL | 9.21 | 532 | ||
ZABALGAÑA | 5.77 | 1335 | ||
OLARIZU | 9.95 | 432 | ||
SALBURUA | 7.03 | 939 | ||
ARABIZKARRA I | 6.88 | 218 | ||
OLD TOWN GASTEIZ | 10.09 | 352 | ||
ABETXUKO | 18,18 | 77 | ||
GAZALBIDE TXAGORRITXU | 13.97 | 315 | ||
Urcabustaiz (Izarra) | 7.5 | 40 | ||
Zuya (Murgia) | 4.84 | 62 | ||
LAKUABIZKARRA | 8.68 | 1221 | ||
ARABIZKARRA II | 8.2 | 256 | ||
JOY OF ALAVA (DULANTZI) | 6.67 | 90 | ||
HAVANA | 9.9 | 222 | ||
IRUÑA DE OCA (NANCLARES) | 10.61 | 66 | ||
LAKUA | 6.67 | 375 | ||
ZIGOITIA (GOPEGI) | 0 | 32 | ||
SALVATIERRA (AGURAIN) | 12.64 | 182 | ||
OTXANDIO | 7.41 | 27 | ||
ZARAMAGA | 17.63 | 397 | ||
LABASTIDA | 9.62 | 52 | ||
OION | 9.94 | 161 | ||
LEGUTIANO (VILLARREAL) | 2.5 | 40 | ||
LAGUARDIA | 5.95 | 84 | ||
Table 1: Numerical representation of data by districts for the variable BMI (Kgrs) according to sex. Reference normal population (P50 Carrascosa study). The percentages indicate the amount of population whose BMI is 1.5 standard deviations above the average for their age. In red is represented the district with more than 10% of the population > 1.5 SDS.
After studying the variables BMI, unemployment rate, per capita income and immigrant population separately, an assessment is made of those districts in the territory that have a higher prevalence of childhood obesity (>10%) in relation to these other variables.
It is observed that there is an indirect relationship between a higher prevalence of childhood obesity expressed as >1.5 SDS according to district and the per capita income recorded in said district expressed in thousands of euros (Fig. 4).
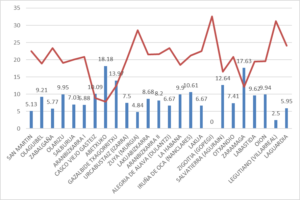
Figure 4: Representation of the variable BMI (% of the population > 1.5 SDS) (blue columns) vs. per capita income (thousands € per inhabitant/year) (red line). The orange line represents the average per capita income of the population, which is €19,366.
Regarding the unemployment rate by district, the opposite is evident, that with per capita income there is a direct relationship between the obesity rate and the unemployment rate. This suggests that both variables are therefore in a possible cause-effect relationship in their effect on the state of child nutrition (Fig. 5).
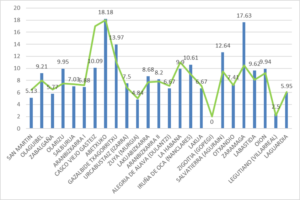
Figure 5: Representation of the variable BMI (% of the population > 1.5 SDS) (blue columns) vs unemployment rate (in % of active population) (green line). The orange line represents the average unemployment rate in the population, which is 7.5%.
Regarding the specific weight of migrants living in a district , in relation to the obesity variable, a possible direct relationship with these epidemiological variables is evident in parallel with the unemployment rate and in contrast to the per capita income (Fig. 6).
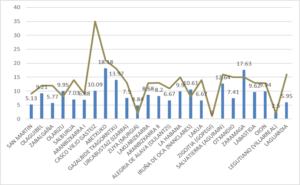
Figure 6: Representation of the BMI variable (% of the population > 1.5 SDS) (blue columns) vs. % of migrated people in relation to the total (brown line). The orange line represents the average rate of the immigrant population, which is 13%.
Discussion
Modern clinical records, combined with new epidemiological research techniques and the use of big data, allow us to propose new health strategies. Different statistical techniques, such as machine learning , have been shown in other fields to be effective in interpreting a large amount of data generated in real life and making decisions about it [7,14-16]. Somatometry in children in general and the problem of obesity in particular are proposed as one of the fields of research.
The secular acceleration of weight relative to height is observed in all populations, even more so in the pediatric population of Western countries [4,5]. A possible additional effect to that observed is that generated by the pandemic and its confinement. Other postulated causes are the relationship with the socioeconomic level of the family, the per capita income and even the degree of stress that the presence of one of its members unemployed causes in a family [8,9].
Health resources are scarce and BIG DATA is proposed as a faster and cheaper way to obtain a real picture of the population situation and therefore to determine where, how and why to invest these scarce resources [15-17].
We point out that our study shows that childhood obesity is present in our population, with towns, neighborhoods or districts with an affectation rate of more than 10% of the entire child population. Obesity occurs at key stages of development, such as pre-pubertal or late pubertal age, which can contribute to maintaining the problem of overweight [4,7,18]. But in addition, our work shows how there are situations not foreign to the environment where a child lives that seem to condition his or her situation regarding the recorded weight [8,9,19,20]. The relationship between income level, quality (and quantity) in food purchases, the possibility of attending extracurricular, educational and sports activities and in general the environment where a child grows up also seems to mark the possibility of suffering or not from obesity [20,21]. Knowing first-hand where, how and in what way to act within the global epidemic of childhood obesity will allow us to optimize the scarce resources we have and to carry out health intervention policies that are as effective as possible [22].
Limitations of The Study
The main limitation of the study is related to the fact that the data used come from the electronic medical record and therefore have not been generated for research purposes. This is why, as described in the literature, errors may occur in the measurement and transcription of the data (Heude B, et al.,). A big -data approach to producing descriptive anthropometric references: a feasibility and validation study of pediatrics growth charts. Lancet Digit Health. 2019;1(8):e413-23). The nature of this study allows it to be repeated periodically, detecting areas of improvement in different subpopulations.
Economic Report
The study will be conducted without funding. The tasks described in the project are undertaken by the principal investigator and his collaborators.
Acknowledgements
This original study has been supported thanks to the work of the Collaborative Group from Basque Center of Applied Mathematics (BCAM). Bilbao, Bizkaia Basque Country, Spain
- Jose A. Lozano Basque Center for Applied Mathematics BCAM
- Ioar Married Tellechea Basque Center for Applied Mathematics BCAM
- Aritz Pérez Postdoctoral Fellow BCAM – Basque Center for Applied Mathematics
Conflict of Interests
The authors have no conflict of interest to declare.
References
- Zamlout A. Syrian national growth references for children and adolescents aged 2-20 years. BMC Pediatr . 2022;22(1):282.
- Tarupi W. Growth references for weight, height and body mass index for Ecuadorian children and adolescents aged 5-19 years. Arch Argent Pediatr. 2020;118(2):117-24.
- Heude B. A big-data approach to producing descriptive anthropometric references: a feasibility and validation study of pediatric growth charts. Lancet Digital Health. 2019;1(8):e413-23.
- WHO Multicentre Growth Reference Study Group. WHO Child Growth Standards based on length/height, weight and age. Minutes Paediatr Suppl. 2006;450:76-85.
- by Onis M. Development of a WHO growth reference for school-aged children and adolescents. Bull World Health Organ. 2007;85(9):660-7.
- Carrascosa Lezcano A. Spanish cross-sectional growth study 2008. Part II: height, weight and body mass index values from birth to adult height. Pediatr (Barc). 2008;68(6):552-69.
- Díez-López I, Maeso- Mendez S, Machón-Sobrado M. A new paradigm in the construction of growth charts in pediatrics. Why not use big data? Endocrinol Metab Int J. 2024;12(3):92-9.
- Wang Y, Lim H. The global childhood obesity epidemic and the association between socio-economic status and childhood obesity. Int Rev Psychiatry. 2012;24(3):176-88.
- Wang Y. Cross-national comparison of childhood obesity: the epidemic and the relationship between obesity and socioeconomic status. Int J Epidemiol. 2001;30(5):1129-36.
- Stavridou A, Kapsali E, Panagouli E, Thirios A, Polychronis K, Bacopoulou F, et al. Obesity in children and adolescents during COVID-19 pandemic. Children. 2021;8(2):135.
- Ferguson TS. A Bayesian analysis of some nonparametric problems. The Annals of Statistics. 1973:209-30.
- Rasmussen C. The infinite Gaussian mixture model. Advances in Neural Information Processing Systems. 1999;12.
- Teh YW, Jordan MI. Hierarchical Bayesian nonparametric models with applications. Bayesian Nonparametrics. 2010;1:158-207.
- Van der Maaten L, Hinton G. Visualizing data using t-SNE. Journal of Machine Learning Research. 2008;9(11).
- Kruskal JB. Nonmetric multidimensional scaling: a numerical method. Psychometrika. 1964;29(2):115-29.
- Gilholm P, Mengersen K, Thompson H. Identifying latent subgroups of children with developmental delay using Bayesian sequential updating and Dirichlet process mixture modelling. PloS One. 2020;15(6):e0233542.
- Diana A, Matechou E, Griffin J, Johnston A. A hierarchical dependent Dirichlet process prior for modelling bird migration patterns in the UK. The Annals of Applied Statistics. 2020;14(1):473-93.
- Ahrens W, Moreno LA, Pigeot I. Childhood obesity: prevalence worldwide-synthesis part I. Epidemiology of Obesity in Children and Adolescents: Prevalence and Etiol. 2010;219-35.
- Wang Y, Monteiro C, Popkin BM. Trends of obesity and underweight in older children and adolescents in the United States, Brazil, China and Russia. Am J Clin Nutr. 2002;75(6):971-7.
- Umekar S, Joshi A. Obesity and preventive intervention among children: a narrative review. Cureus. 2024;16(2):e54520.
- Goel A, Reddy S, Goel P. Causes, consequences and preventive strategies for childhood obesity: a narrative review. Cureus. 2024;16(7):e64985.
- Antwi F, Fazylova N, Garcon MC, Lopez L, Rubiano R, Slyer JT. The effectiveness of web-based programs on the reduction of childhood obesity in school-aged children: A systematic review. JBI Book Syst Rev. 2012;10(42 Suppl):1-14.
Article Type
Research Article
Publication History
Received Date: 14-10-2024
Accepted Date: 28-10-2024
Published Date: 04-11-2024
Copyright© 2024 by Diez-Lopez I, et al. All rights reserved. This is an open access article distributed under the terms of the Creative Commons Attribution License, which permits unrestricted use, distribution, and reproduction in any medium, provided the original author and source are credited.
Citation: Diez-Lopez I, et al. The Socio-Economic Situation of a Population as a Determinant of Childhood Obesity: Answers from Big Data. J Pediatric Adv Res. 2024;3(3):1-10.

Figure 1: Representation of the rate of people of foreign origin living in the territory of the Basque Country in % according to district. Color code. Source EUSTAT 2023.

Figure 2: Representation of capita income expressed in euros/year by district of the Basque Country territory in %. Color code. Source EUSTAT 2023.

Figure 3: Representation of the unemployment rate expressed as a % of the active population according to districts of the Basque Country in %. Color code. Source EUSTAT 2023.

Figure 4: Representation of the variable BMI (% of the population > 1.5 SDS) (blue columns) vs. per capita income (thousands € per inhabitant/year) (red line). The orange line represents the average per capita income of the population, which is €19,366.

Figure 5: Representation of the variable BMI (% of the population > 1.5 SDS) (blue columns) vs unemployment rate (in % of active population) (green line). The orange line represents the average unemployment rate in the population, which is 7.5%.

Figure 6: Representation of the BMI variable (% of the population > 1.5 SDS) (blue columns) vs. % of migrated people in relation to the total (brown line). The orange line represents the average rate of the immigrant population, which is 13%.
Women in 2022 – % of population with BMI>1.5 SDS by neighborhood or district | ||||
DISTRICT | % | No. of samples | ||
Saint Martin | 7.58 | 541 | ||
OLAGUIBEL | 7.38 | 542 | ||
ZABALGAÑA | 8.22 | 1386 | ||
OLARIZU | 6.32 | 364 | ||
SALBURUA | 6.37 | 832 | ||
ARABIZKARRA I | 6.53 | 199 | ||
OLD TOWN GASTEIZ | 10,20 | 330 | ||
LOWER RIVER BAY (RIVABELLOSA) | 4.35 | 23 | ||
SANSOMENDI | 5 | 36 | ||
ABETXUKO | 17,28 | 81 | ||
GAZALBIDE TXAGORRITXU | 11.25 | 329 | ||
Urcabustaiz (Izarra) | 2.22 | 45 | ||
Zuya (Murgia) | 6.25 | 48 | ||
LAKUABIZKARRA | 8.06 | 1240 | ||
ARABIZKARRA II | 9.72 | 257 | ||
JOY OF ALAVA (DULANTZI) | 12.5 | 80 | ||
HAVANA | 6.49 | 185 | ||
IRUÑA DE OCA (NANCLARES) | 3.95 | 76 | ||
LAKUA | 5.81 | 396 | ||
ZIGOITIA (GOPEGI) | 0 | 36 | ||
SALVATIERRA (AGURAIN) | 7.36 | 163 | ||
OTXANDIO | 10.71 | 28 | ||
ZARAMAGA | 15.47 | 362 | ||
LABASTIDA | 11.47 | 61 | ||
OION | 6.55 | 168 | ||
LEGUTIANO (VILLARREAL) | 12.5 | 32 | ||
LAGUARDIA | 2.97 | 101 | ||
Men year 2022 – – % population with BMI>1.5 SDS by neighborhood or district | ||||
DISTRICT | % | No. of samples | ||
Saint Martin | 5.13 | 546 | ||
OLAGUIBEL | 9.21 | 532 | ||
ZABALGAÑA | 5.77 | 1335 | ||
OLARIZU | 9.95 | 432 | ||
SALBURUA | 7.03 | 939 | ||
ARABIZKARRA I | 6.88 | 218 | ||
OLD TOWN GASTEIZ | 10.09 | 352 | ||
ABETXUKO | 18,18 | 77 | ||
GAZALBIDE TXAGORRITXU | 13.97 | 315 | ||
Urcabustaiz (Izarra) | 7.5 | 40 | ||
Zuya (Murgia) | 4.84 | 62 | ||
LAKUABIZKARRA | 8.68 | 1221 | ||
ARABIZKARRA II | 8.2 | 256 | ||
JOY OF ALAVA (DULANTZI) | 6.67 | 90 | ||
HAVANA | 9.9 | 222 | ||
IRUÑA DE OCA (NANCLARES) | 10.61 | 66 | ||
LAKUA | 6.67 | 375 | ||
ZIGOITIA (GOPEGI) | 0 | 32 | ||
SALVATIERRA (AGURAIN) | 12.64 | 182 | ||
OTXANDIO | 7.41 | 27 | ||
ZARAMAGA | 17.63 | 397 | ||
LABASTIDA | 9.62 | 52 | ||
OION | 9.94 | 161 | ||
LEGUTIANO (VILLARREAL) | 2.5 | 40 | ||
LAGUARDIA | 5.95 | 84 | ||
Table 1: Numerical representation of data by districts for the variable BMI (Kgrs) according to sex. Reference normal population (P50 Carrascosa study). The percentages indicate the amount of population whose BMI is 1.5 standard deviations above the average for their age. In red is represented the district with more than 10% of the population > 1.5 SDS.


